The
Settings view allows you to manage general settings, save/restore backups, and reset the app.
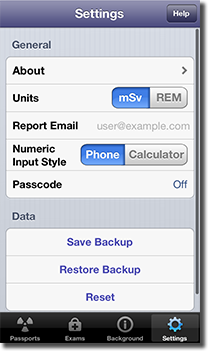
General
Tap
About to view app info, contact details, or to write an app review. The
Store section (Radiation Passport only) displays a list of upgrades available for purchase. Purchase the
Pro upgrade to track an unlimited number of users. Tap the
Restore Previous Purchases button to restore any previous upgrades you have purchased. Note that you are only charged once for an upgrade.
The
Units setting specifies which units to use throughout the app. Tap
mSv to use millisieverts or
REM to use REM units.
The
Report Email field sets the default email address to use when emailing a medical radiation exposure and risk report.
The
Numeric Input Style sets the style of the numeric keyboard to use. The
Phone style lays the keyboard out similar to a phone keypad with numbers incrementing from the top. The
Calculator style is the opposite with numbers displayed similar to a calculator.
The
Passcode setting allows you to set a four digit passcode that is required at startup to unlock Radiation Passport. The passcode must also be entered when switching to Radiation Passport from the background. Do not lose the passcode since there is no way to retrieve your data if lost.
Data
You can save or restore a backup file for Radiation Passport. The backup file includes all users (with details/photos) and their medical exams and background exposure. The file is transferred over WiFi. Make sure both the device and computer are connected to the same WiFi network. Open the URL in a browser on your computer. Note that restoring a backup file will replace any existing users and their exams and background exposure.
Tap
Reset to reset Radiation Passport back to its original state. This will delete all users and their exams and background exposure. It will also reset all settings.
 Passports
 Exams
Exams
 Background

 Settings